1. GROWTH VALUE SPREAD
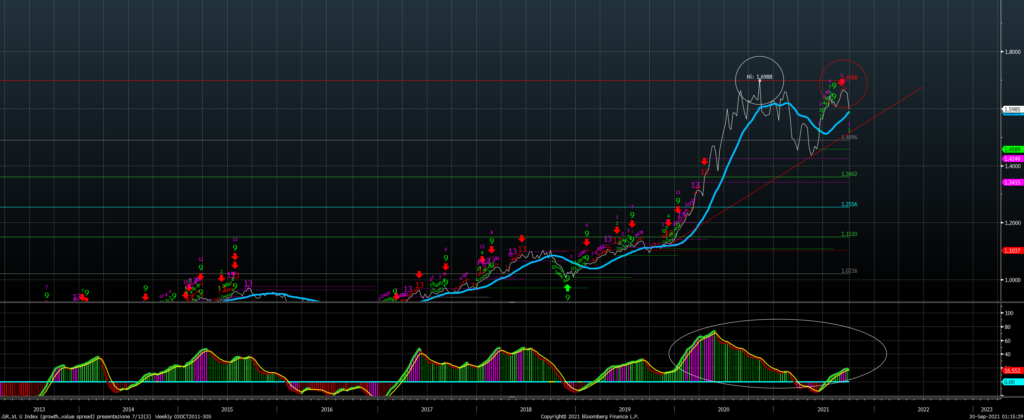
This spread is in a potential double top pattern: level of 1,69 is a key level.
Our trading system is short on daily pattern and will give a sell signal on weekly charts below 1,5580 (last price is 1,5985).
We signal a potential divergence between spread and momentum indicator, that usually is bearish.

2. EUROSTOXX VS NASDAQ INDEX
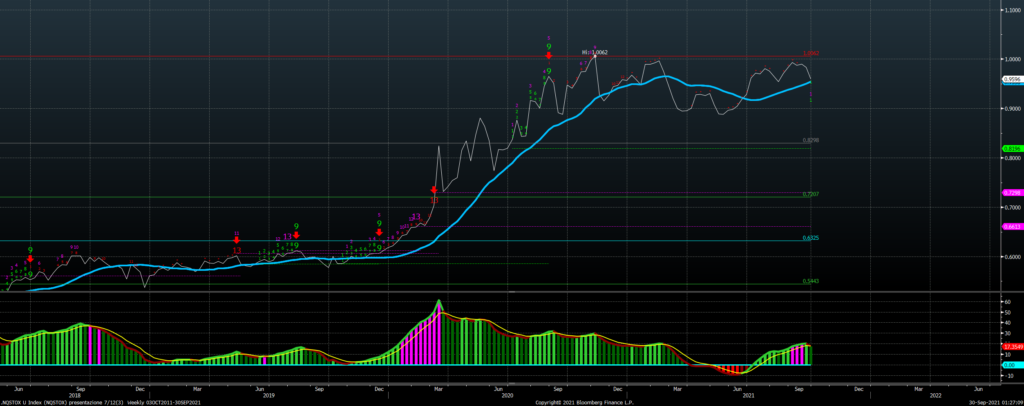
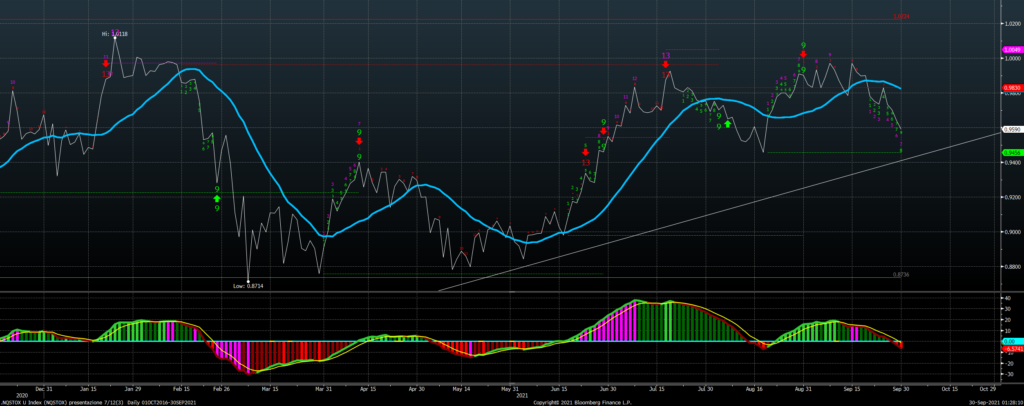
Very similar pattern we saw on the spread Eurostoxx vs Nasdaq: potential long term double top at 0,99 with key support at 0,94 (last level marked is 0,9596 today).
In case of break of support next level is 0,81.
Trading system is short on this spread on daily chart.
Also on this chart, we note a potential divergence between indicator and spread.
DEMARK neutral on weekly chart and BEARISH on daily chart.


