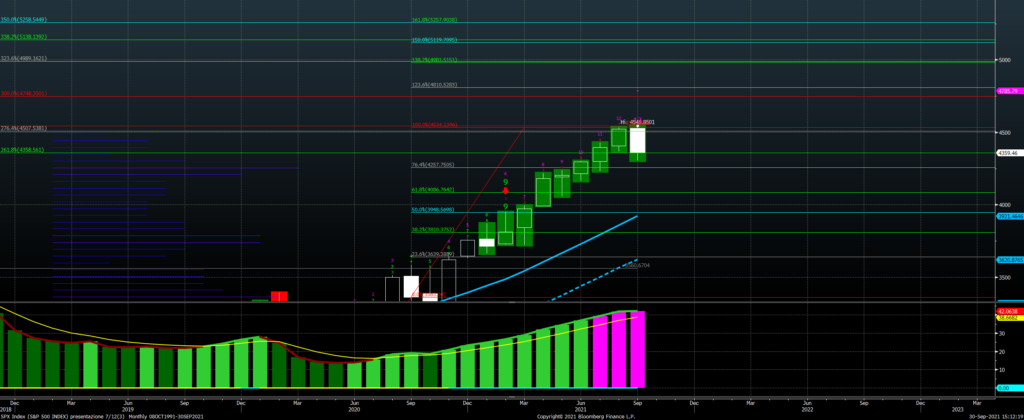
I want to bring to your attention a possible long term sell signal on Sp500 index, based on analysis on monthly chart.
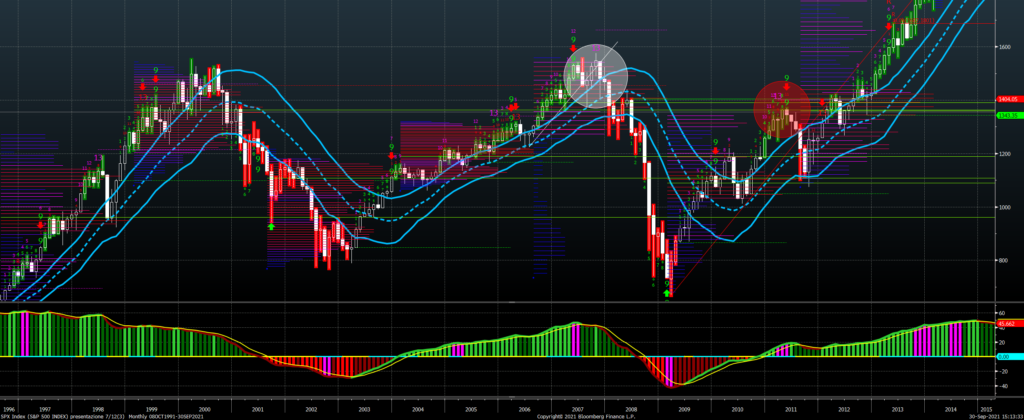
DEMARK analysis signals a “13” setup this month: accordingly to this analysis method, when the market has a time exhaustion of 13 months, a pause of few months if not an inversion of few months is likely.

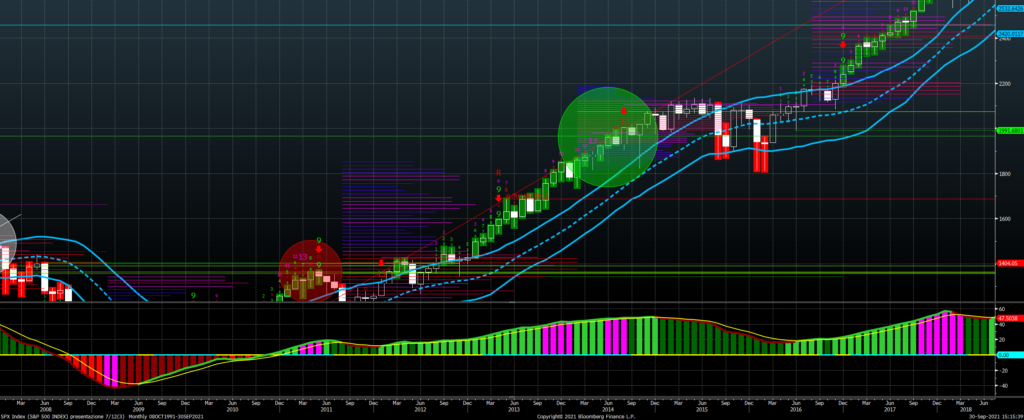
Please compare this phase also with October 2007 and April 2011:

Of course the market is not always inverting its trend: this did not happened for instance, in 2014.
If the market after a 13 sets new highs in forthcoming months, the bearish signal will be rejected.
If after a month with a 13 we have another month setting new lows below the lows hit in the previous month, we can consider the retracement in place.
Therefore we have to check the first 15 days of October to see whether the market will set new lows for the period.
Major support in case of retracement will be 3,900 points.


