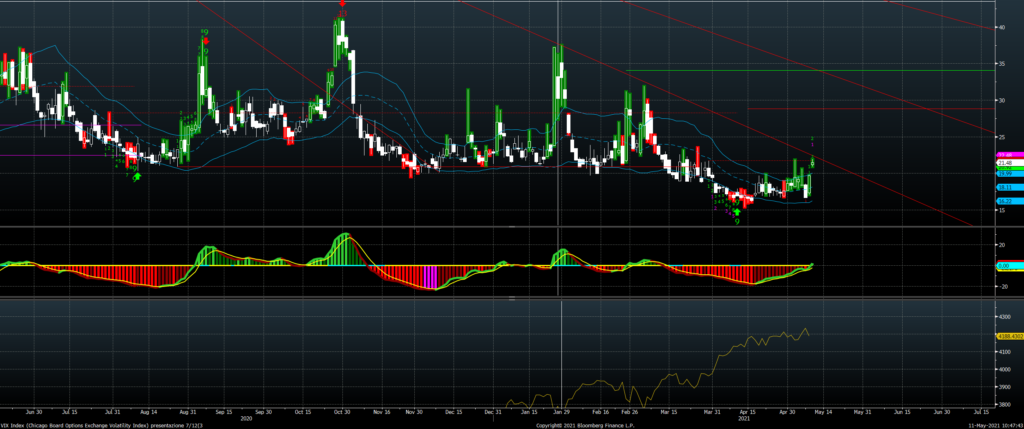
Analyzing the volatility on US stocks (VIX), we are very close to a first important level on daily chart:
22,60.
Our trading system is long (cfr green bars) and also our momentum indicator is bullish.
In case of break of this level, on daily chart we have these levels:
28,90
34
Needless to say that a break on the upside could bring to an important stock market correction: with a VIX at 29 the SP500 was at 3,700 points.