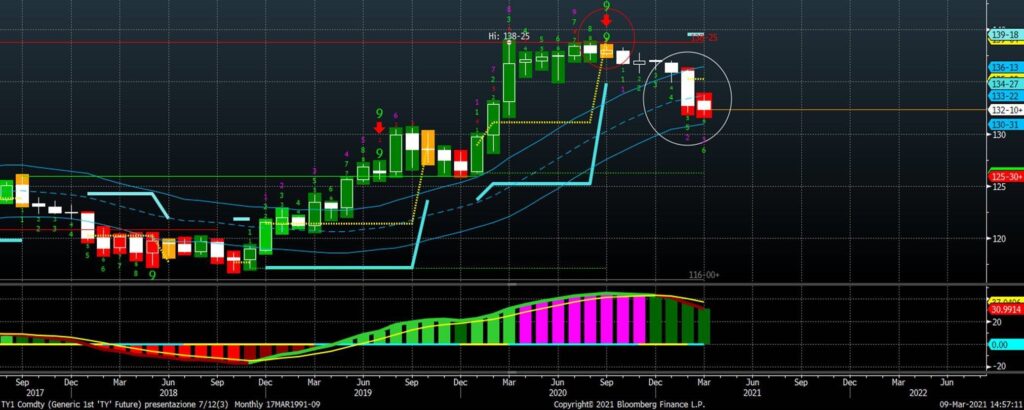
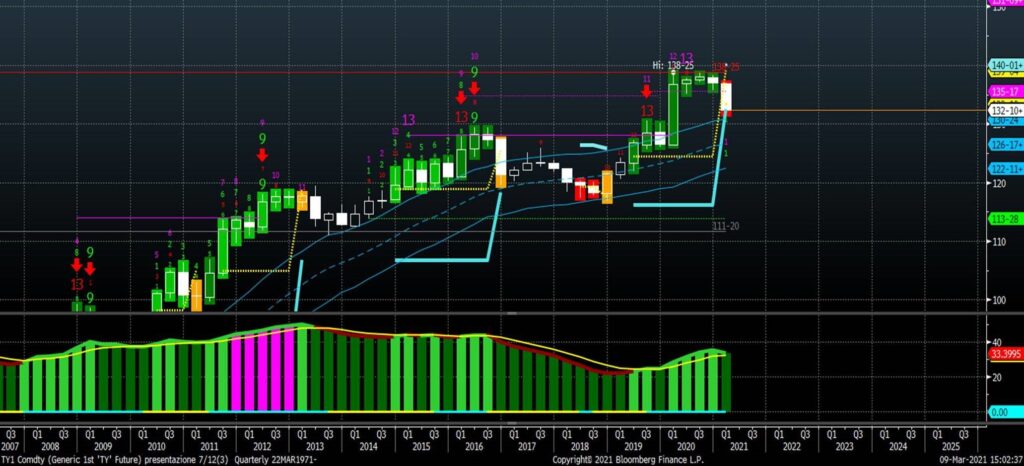
In our long term analysis on Treasury note FUTURE, we stress the potential risk of a fall of few months.
- We had a “9” setup that usually brings to a retracement;
- Our system is short because we have two consecutive months with red bar: please check the period January/October 2018 (9 months) in which our system was short;
- First support has been violated;
- At the breaking of 130 10/32 levels on a MONTHLY BASIS (therefore with a close below this level in the last day of the month, the market could retrace at least to 125 10/32.
We want to remember that in 2018 the stock markets had a severe fall from September up to the end of December, after the fall in bond prices during the year.

Looking at a very long term chart (treasury notes prices from 1982 onwards), we have a risk of a very important sell signal of the TRASURY NOTE will close next quarter below 129.
→ in this scenario the fall of prices in the coming months could bring the treasury note future down to 121-122;
→ we stress also the “13” countdown completed in July last year. Bear signal.

Last but not least, CBOT reported in these days that treasury futures saw record increase in net speculative short positions.


