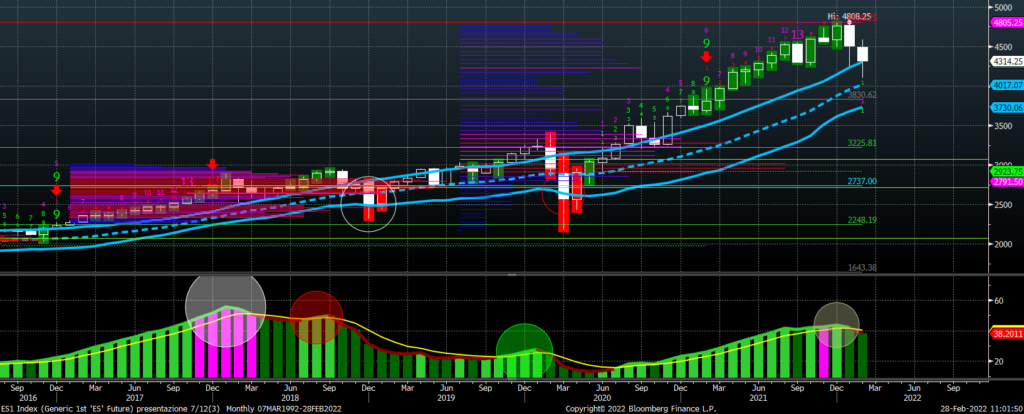
Analysis on monthly chart.
Although on support (4300), we think that the bullish trend started to deteriorate: this is due to a sell signal on momentum indicator placed on bottom of chart (in the previous signals the market retraced down to the support blue line on our model).
More likely level of support on long term is for us 3700 (the low blue line on chart), with intermediate support at 4020.
Market returns bullish with a monthly close above 4,630.

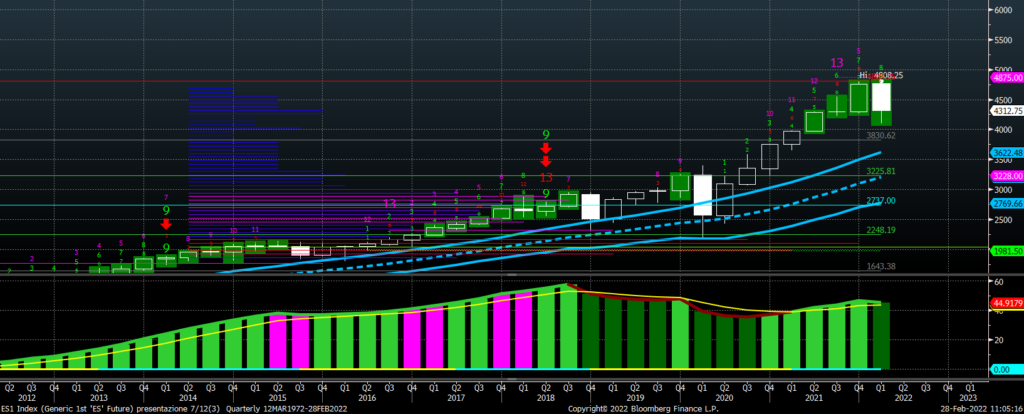
Also on more long term chart we risk the starting of a medium term bear market:
DEMARK has completed a 13 bearish sequence last quarter, and also on this chart we risk a sell signal on momentum indicator.
Support on this chart is 3600 points area.


